The PSISearch2D web application provides a user-guided webform interface to submit sequence search step by step. Please click the button below to launch analysis jobs.
Launch starts from here.
Follow the instructions below: get to the homepage, enter the disease or phenotype, enter your email if you wannt to recevie email for notification. Than submit!
Gene Selection and Region Selection are selected to conduct region specific and gene specific prioritization.
Advanced Options could be chosen to shut off the Phenotype interpretation, or choose all diseases.
Weight Adjust could be chosen to adjust the weights of different databases, or selectively shut off some databases by setting 0.
Usually in 30 seconds, the result page will show up (several minutes if you choose Word Cloud).
There are four types of contents in the result page
Network is the gene-gene-disease interaction network. The interactive options are highlighted below.
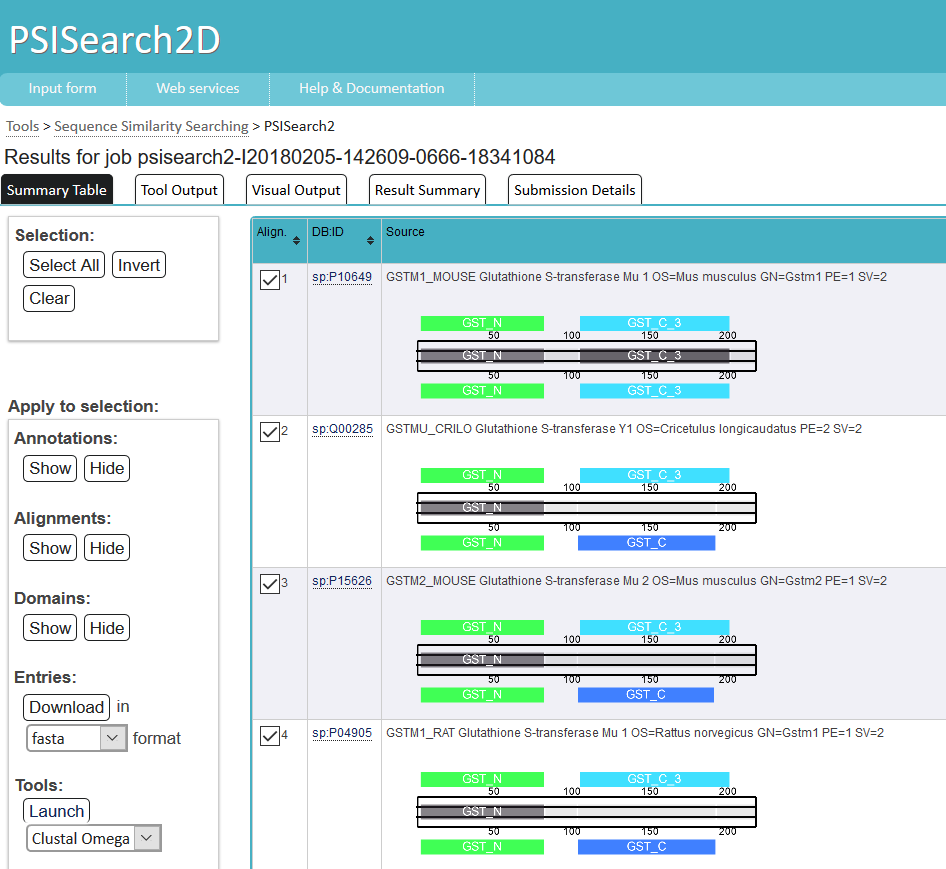
Summary is the summary of the result. Including the download links of the report, genelist and the interpreted diseases.
Interpreted Diseases are the specific diseases names and synonyms separated by semicolon, followed by the data source or reliability(tab as delemiter) , corresponding to each disease/phenotype term.
Word Cloud tag is shown up if you have selected 'WordCloud' option in the submission form.
Report is the report containing the detailed information of each gene in the result, including each relation with the disease and seed genes.
Gene Scores are just a list with 'Rank''Gene''Entrez ID''Score', separated by tab.
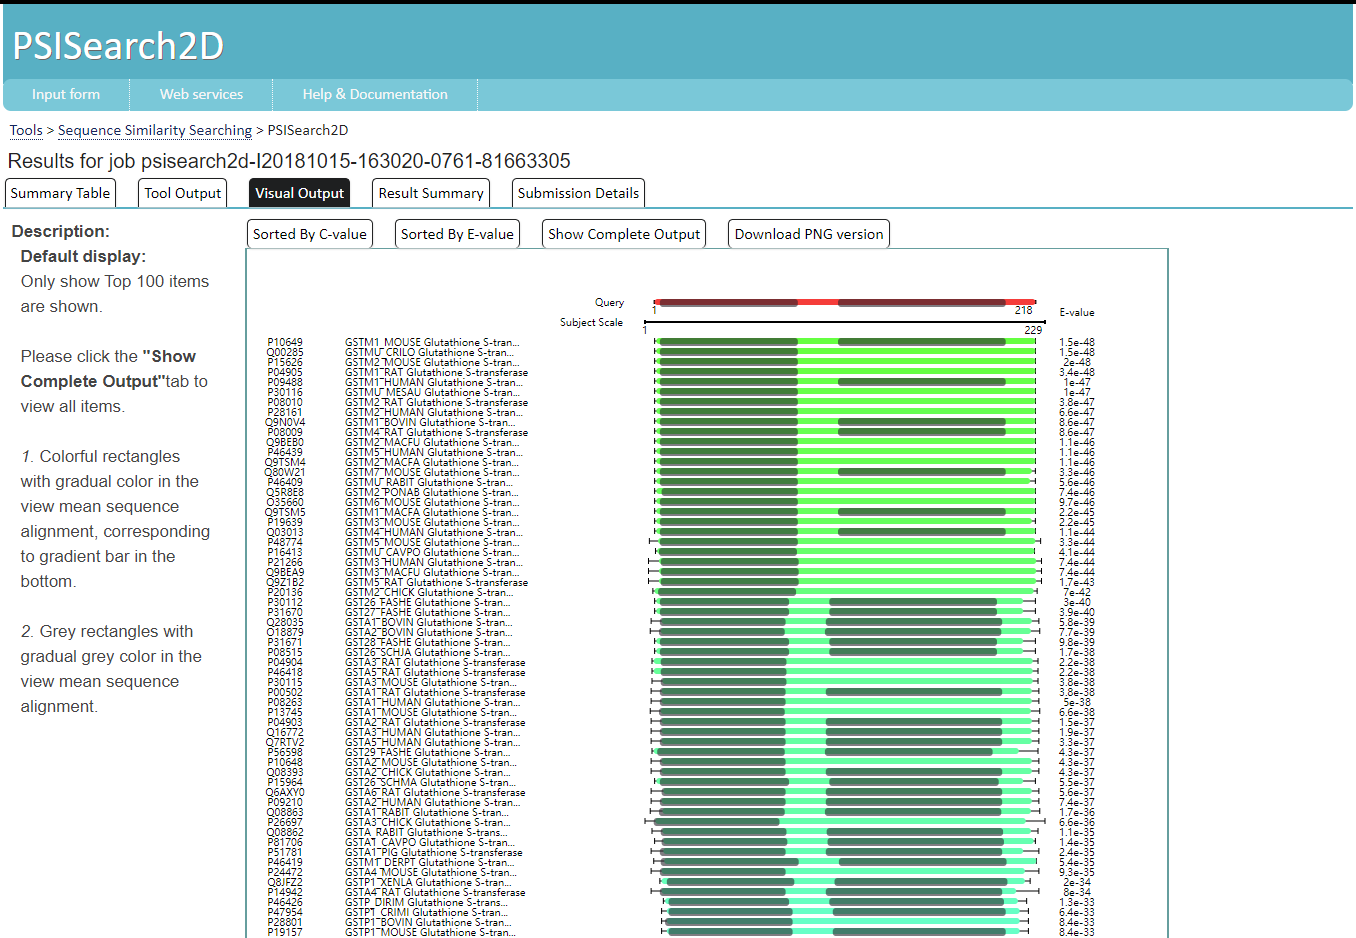
Barplot shows at most top 500 genes. Users could click the gene name to go to the NCBI website of this gene. The bar could also be clicked to see its details. What should be NOTICED is some lower score genes might not have details available, due to too many details. The score is right beside each bar.