A detailed tutorial for ncRPheno
1. About ncRPheno
ncRPheno is a comprehensive database platform that provides experimentally supported associations between noncoding RNAs (ncRNAs, including miRNA, lncRNA, circRNA, snoRNA and piRNA etc.) and disease phenotypes across 11 species (including Homo sapiens, Mus musculus, Rattus norvegicus, Macaca mulatta, Sus scrofa, Pan troglodytes, Marmoset, Gallus gallus, Canis familiaris, Zebrafish and Rabbit). ncRNAs have been experimentally validated as a novel class of biomarkers and potential drug targets for disease diagnosis, therapy and prognosis. The discovery of relationships between ncRNAs and disease phenotypes has become increasingly important. ncRPheno provides experimentally validated associations between ncRNAs and disease phenotypes through homogenizing integration of the association data from 24 manually curated databases(As shown in the following table). ncRPheno provides user-friendly web interfaces and RESTful application programming interfaces for users to browse, search, prioritize, analyze and access data freely.
Table 1. The integrated resources in ncRPheno.
| Resource name | Description |
|---|---|
| RNAcentral | A hub of information for non-coding RNA sequences. |
| miRBase | A database for microRNA sequences and function. |
| LncRNADisease v2.0 | An updated database of long non-coding RNA-associated diseases. |
| miR2Disease | A manually curated database for microRNA deregulation in human disease. |
| HMDD v3.0 | A database for experimentally supported human microRNA-disease associations. |
| miREnvironment | A database provides a bridge for microRNAs, environmental factors and phenotypes. |
| circRNA disease | A manually curated database of experimentally supported circRNA-disease associations. |
| NSDNA | A manually curated database of experimentally supported ncRNAs associated with nervous system diseases. |
| SM2miR | A database of experimentally validated small molecules' effects on microRNA expression. |
| DLREFD | A database providing associations of long non-coding RNAs, environmental factors and phenotypes. |
| lncRNASNP2 | An updated database of functional SNPs and mutations in human and mouse lncRNAs. |
| miRNASNP | An updated database for better SNP selection by GWAS data, miRNA expression and online tools. |
| NPInter v3.0 | An upgraded database of noncoding RNA-associated interactions. |
| miRSponge | A manually curated database for experimentally supported miRNA sponges and ceRNAs. |
| LncReg | A reference resource for lncRNA-associated regulatory networks. |
| Experimental Factor Ontology | A database provides a systematic description of many experimental variables available in EBI databases, and for projects such as the GWAS catalog. |
| Lnc2Cancer v2.0 | An updated database of experimentally supported long non-coding RNAs in human cancers. |
| GWAS Catalog | The new NHGRI-EBI Catalog of published genome-wide association studies. |
| Ensembl | A database for aggregating, processing, integrating and redistributing genomic datasets |
| piRNABank | A web resource for classified and clustered Piwi-interacting RNAs. |
| circBase | A database for circular RNAs. |
| snoRNA-LBME-db | A comprehensive database of human H/ACA and C/D box snoRNAs. |
| Evidence and Conclusion Ontology | A community standard for evidence information. |
| Human Phenotye Ontology | A database provides a standardized vocabulary of phenotypic abnormalities encountered in human disease. |
2. The ncRPheno web interfaces
The ncRPheno database platform has been tested on Firefox 68.0, Google Chrome 61 and Safari.
2.1 Browse and search:
The ‘Browse’ webpage and ‘Search’ webpages in ncRPheno allow users to quickly retrieve ncRNA-disease associations through searching ncRNA and disease phenotype. The resulting association data is displayed in a brief table, showing key information of association identifiers (IDs), ncRNA symbols, disease phenotypes with ontology identifier and association scores for prioritization (Figure 1A). The resulting association data of the disease search allows to optionally visualize in a word-cloud diagram (Figure 1B). Similarly, the resulting association data of the ncRNA search allows to optionally visualize in a disease-tree or -network diagram (Figure 1C and D). The association IDs in the table (Figure 1A), ncRNA symbols in the word-cloud diagram (Figure 1B) and circle nodes in the disease-tree diagram (Figure 1C) link to further information of ncRNA, disease phenotype and the supporting evidences in publications (Figure 1E). External links to other reference resources are also provided such as PubMed, miRBase, Ensembl, EFO etc. (Figure 1E).

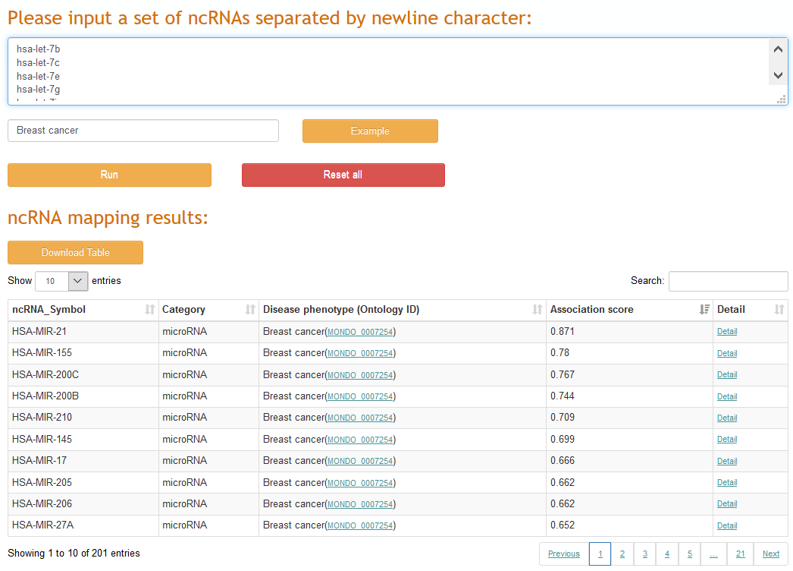
2.2 ncRNA prioritization application:
To assist to identify disease-related ncRNAs from large-scale ncRNAs, a ncRNA prioritization application was implemented in ncRPheno to prioritize a set of ncRNAs to a corresponding disease phenotype. The resulting table allows sorting by association scores and filtering by specific ncRNA (Figure 2) , and links to further webpages for detailed information.
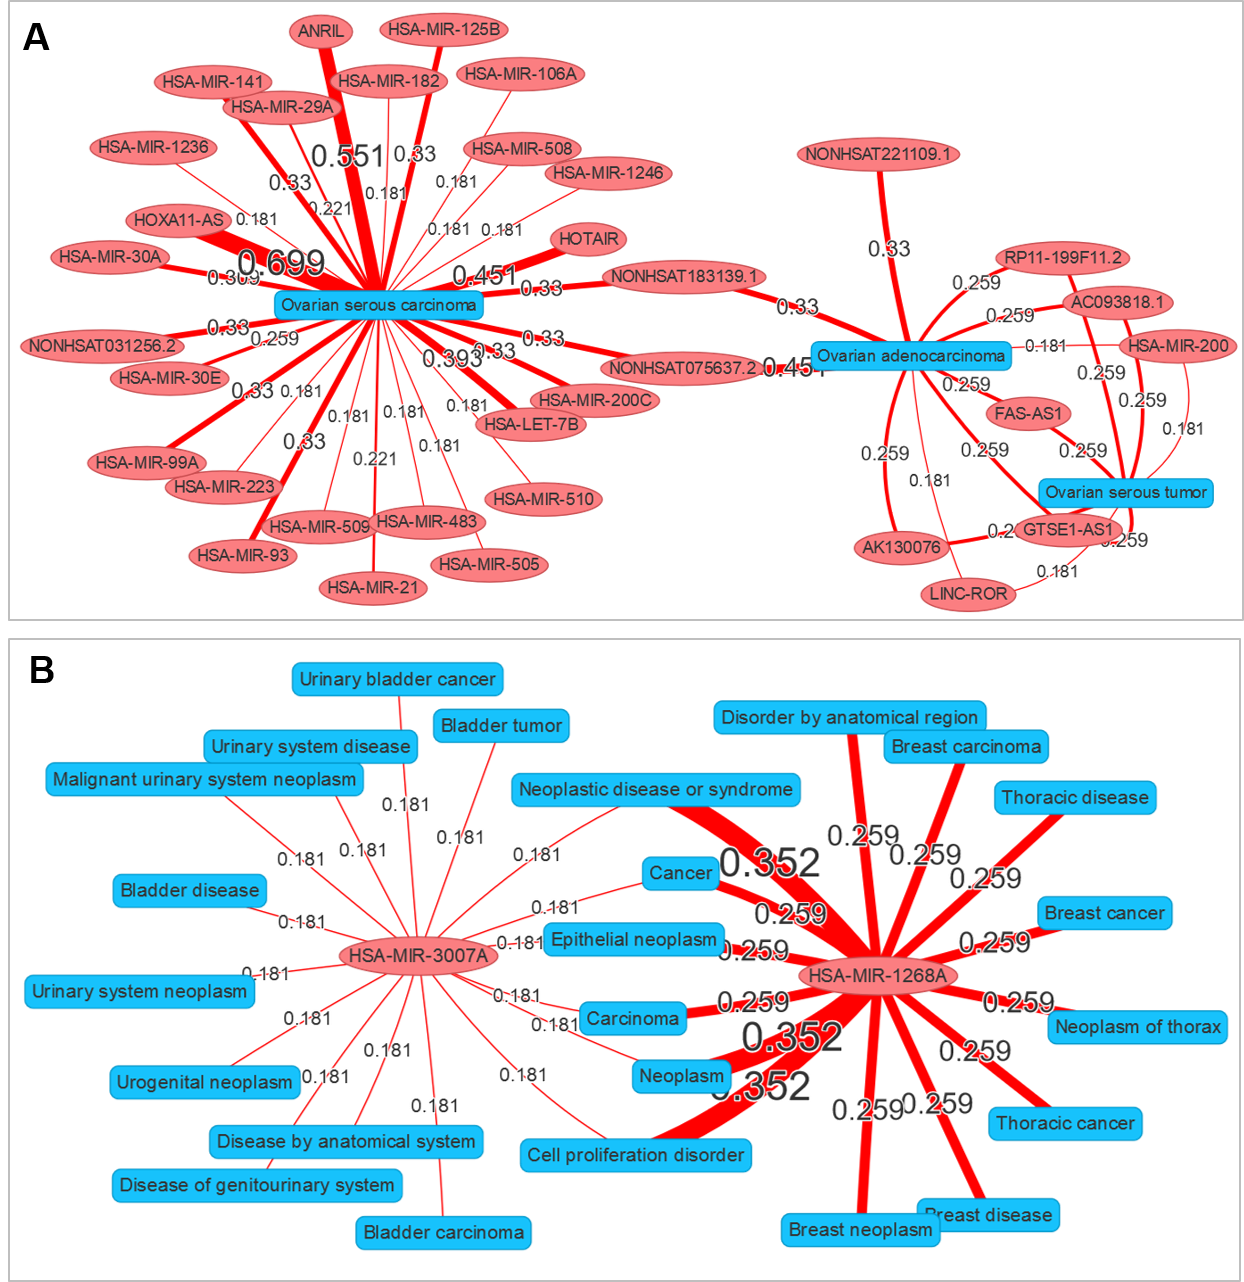
2.3 Network visualization application:
A network visualization application was implemented in ncRPheo to explore the relationships between different diseases and ncRNAs. The application allows user to enter a set of diseases or ncRNAs, and to generate interaction network to display the association data (Figure 3) .
2.4 Other application interface:
The website also offers RESTful application programming interfaces (APIs) to access the data programmatically. All resources are accessible through simple RESTful URLs by querying and retrieving an individual entry as well as sets of entries. Output data are available in universal JSON and text formats. Documentation of APIs are available online. All association data in ncRPheno can be freely downloaded. In addition, ncRPheno encourages users to submit their new association data for future data integration. Once checked by our professional curators and approved by the submission review committee, the submitted records will be included in a future release. Furthermore, a detailed tutorial is available on the ‘Help’ webpage.
3. Computation of association score
Experimental evidences in publications such as experiment methods, number of publications and diseases parent-child relationships have been included to support the associations. An association scoring model has been established based on these evidential metrics and integrated in ncRPheno to prioritize and interpret the ncRNA dysregulation-disease associations. The association scoring model consists of four steps to compute the association scores.
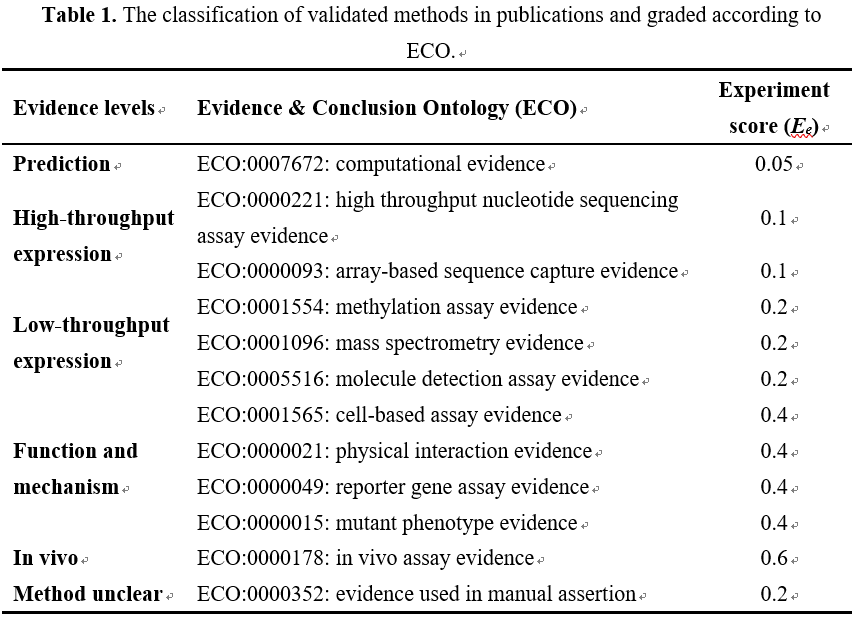
Step 1: The experiment methods indicated in publications were annotated with the categories of Evidence & Conclusion Ontology (ECO), and then classified into different evidential levels, including high-throughput expression level, low-throughput expression level, function and mechanism analysis level, in vivo analysis level, etc. (Table 1) . Each evidential level was given with an experiment score (Ee) according to their reliability. In principle, experiment methods for in vivo analysis, mechanism and functional analysis provide more reliable evidence than RNA expression experiments. Therefore, different experiment methods in publications are empirically defined and detailed in Table 1). The evidential value (Ep) of a supporting publication for a ncRNA-disease association is summed up with experiment scores (Ee) as the following equation [1]:
In equation [1], ‘n’ represents the total number of supporting experiment methods in the publication, and Eei is the experiment score for a supporting experiment method ‘i’ in the publication.
Step 2: A larger number of publications can enhance the evidential values for the same ncRNA-disease association. The evidential value (E) of an association with multiple supporting publications is derived by using a harmonic sum function (PMID:19107201, PMID:27899665), not only to account for replication but also to dampen the effect of a large number of publications by calculating as the following equation:
In equation [2], ‘m’ represents the total number of supporting publications, and Ep1, Ep2, Ep3, …, Epm are the sorted evidential values of different supporting publications in descending order.
Step 3: Only the disease subclasses with direct supporting publications can propagate the evidences along the parental nodes. For example, in the EFO database, “non-small cell lung adenocarcinoma” is a subtype of “non-small cell lung carcinoma”, which is a subtype of “lung carcinoma”. When “non-small cell lung adenocarcinoma” and “non-small cell lung carcinoma” have directly supporting evidences from publications, both evidences can be propagated to “lung carcinoma”. Similarly, other evidence information can be derived based on the EFO data. Therefore, take into consideration all the inferred evidences of EFO parent-child relationships and properties, a final evidential value (F) is computed by using a harmonic sum function(PMID:19107201, PMID:27899665), not only to account for replication but also to dampen the effect of a large number of inferred evidences by calculating as the following equation:
In equation [3], ‘j’ represents the number of all of disease subclasses and itself, and E1, E2, E3, …, Ej are the sorted evidential values of disease subclasses and itself in descending order.
Step 4: The final evidential value (F) above is normalized to limit the range of final association scores (Score) from 0 to 1.0.
In equation [4], ‘e’ represents the natural constant e.
4. Data attribute
The following information can help you to interpret ncRNA-disease associations.
ncRNA
To make the ncRNA symbols more consistent with other databases, ncRPheno provides both the identifiers and links for the miRNAs in the miRBase database, the lncRNAs in the Ensembl and RNAcentral database, the piRNA in the piRBase, the snoRNAs in the RNAcentral and snoRNA-LBME-db database.
Disease phenotype
To make the disease phenotypes more consistent with other databases, ncRPheno provides both the identifiers and links for the disease phenotypes in the EMBL-EBI Ontology Lookup Service resources, including Experimental Factor Ontology (EFO), Orphanet Rare Disease Ontology (ORDO), Human Phenotype Ontology (HPO), Human Disease Ontology (HDO) and NCI Thesaurus OBO Edition (NCIT) etc. The majority of diseases phenotypes in ncRPheno are annotated by EFO, while the rest disease phenotypes, which EFO does not cover, are annotated by other ontologies.
5. Contact us
If you have any inquiries, please do not hesitate to contact us via email: liweizhong@mail.sysu.edu.cn or zhangwl25@mail2.sysu.edu.cn